Run Date: 2026-10-24 01:39:12.073626 Copyright (c) Citizens' Oversight
107 ballots selected (68 hand-marked, 39 BMD), grouped into review-priority rounds. See the Statistics section below for what each round guarantees, and for full run parameters/methodology.
Open TargetMapper to review/correct this job's style mapping.
Open the ACRE Review App to compare each selected ballot's image against its CVR record, filter to specific rounds or contests, mark each contest as matching or not (with a reason if not), and export your review. Any mismatch is a direct, ballot-level finding -- no cross-referencing required.
| Round | Total Ballots | Hand-Marked Ballots | Votes Added (Hand-Marked) | BMD Ballots | Votes Added (BMD) |
|---|---|---|---|---|---|
| 1 | 46 | 35 | 221 | 11 | 305 |
| 2 | 61 | 33 | 93 | 28 | 172 |
Run Date: 2026-10-24 01:39:06.693546 Copyright (c) Citizens' Oversight
| Parameter | Value | Description |
|---|---|---|
| acre_mode | contest-based style | Stratification granularity |
| random_seed | 42 | |
| include_writeins | False | Write-in-used counted as its own coverage stratum |
| include_uncontested_contests | False | |
| rla_risk_percent | 5% | Risk limit used for the RLA sample-size column |
| selection_order | confirmed | Strata processed smallest-to-largest by size; one ballot chosen at random (weighted toward unseen contest-based style/batchid) within each stratum |
| swaps_coverage_phase2 | False | ACRE design doc Phase 2 (Swaps Coverage) run as its own selection pass |
| total_ballots_selected | 107 | After tiering-driven pruning -- see review_tiers_rounds below |
| total_ballots_bmd | 39 | Of which BMD |
| total_ballots_hand_marked | 68 | Of which hand-marked |
| total_ballots_with_writein | 0 | Selected ballots that happen to carry a write-in |
| total_ballots_if_writeins_required | 110 | |
| total_ballots_if_writeins_not_required | 107 | |
| total_strata | 791 | Worst-case ballots needed with one sample per votable option and no cascade coverage at all |
| sample_pct_of_worst_case | 13.5% | total_ballots_selected / total_strata -- how much cascade coverage (one ballot covering many contests at once) saved versus the one-sample-per-option worst case |
| review_tiers_rounds | 4 tiers / 2 rounds | See Review Tiers section -- same ballots as total_ballots_selected, grouped by review priority, not a separate sample |
| total_contests_in_eif | 53 | |
| contests_uncontested | 10 | Every listed option would win regardless (vote_for >= num listed options) |
| contests_contested | 43 | |
| contests_included_in_coverage | 43 | |
| within_contest_swap_coverage_pct | 60.5% | 130 of 215 same-contest option pairs covered -- both members individually selected somewhere in the sample |
| adjacent_yesno_swap_coverage_pct | N/A | 0 of 0 same-label pairs (Yes vs. Yes, No vs. No) across adjacent Yes/No contests, where a selected ballot shows the two answers differing |
| max_rla_n | 229 | Largest single-contest RLA sample size needed (risk limit 5%) among contests with a nonzero margin |
Ballots are grouped into review-priority rounds.
Round 1 alone covers every contest option, undervote, overvote, and write-in-used check, on at least one contest-based style. That's enough to catch an error affecting every style.
Later rounds add coverage of the remaining contest-based style variants.
A reviewer can stop after any round once that round's coverage guarantee is met, or split rounds across reviewers.
Rounds are not a separate sample. They relabel the same selected ballots used everywhere else in this report.
| Round | Ballots in round | Cumulative ballots | Votes Added (Hand-Marked) | Votes Added (BMD) |
|---|---|---|---|---|
| 1 | 46 | 46 | 221 | 305 |
| 2 | 61 | 107 | 93 | 172 |
(4 raw coverage tiers combined into 2 rounds of ~300 ballots each -- see tier_round_target_size.)
Rounds above bundle these finer-grained raw tiers into a simpler presentation layer. See compute_acre_tiers() for how tiers are computed.
Contest-based styles this tier: how many distinct contest-based styles this tier's picks touched. This count varies enormously by election. A small jurisdiction might have a dozen total contest-based styles. A large county can have several hundred. Use this count, not raw ballot counts, to compare this run's shape against a different election's.
Dominant contest(s): the contest with the most explicit picks in that tier (ties listed together). A contest with many style variants naturally dominates the tiers right before its coverage runs out. That's why the long tail often shows one or two contests repeating across several tiers in a row. This is expected, not a bug or an unusually large sample.
Votable options covered % and Strata coverage %: running totals through the end of that tier. See the chart below for the full-resolution shape.
| Tier | Round | Contest-based styles this tier | Ballots this tier | Cumulative ballots | Critical this tier | Dominant contest(s) | Dominant contest picks | Votable options covered % | Strata coverage % |
|---|---|---|---|---|---|---|---|---|---|
| 1 | 1 | 12 | 46 | 46 | 46 | MEMBER, BOARD OF EDUCATION | 7 | 100.0 | 66.5 |
| 2 | 2 | 9 | 49 | 95 | 49 | MEMBER, BOARD OF EDUCATION | 14 | 100.0 | 98.0 |
| 3 | 2 | 7 | 10 | 105 | 10 | PRESIDENT AND VICE PRESIDENT | 4 | 100.0 | 99.7 |
| 4 | 2 | 1 | 2 | 107 | 2 | PRESIDENT AND VICE PRESIDENT | 2 | 100.0 | 100.0 |
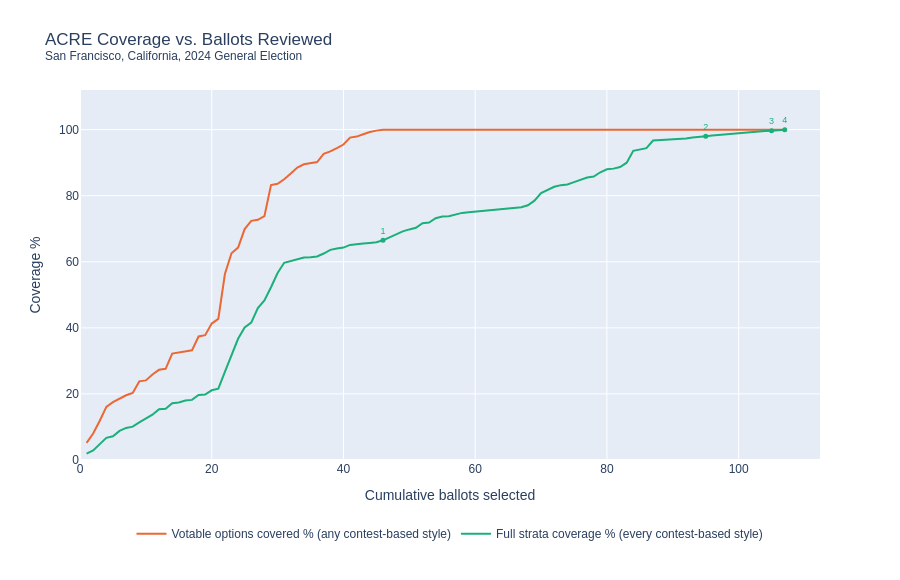
Two set-cover progress curves share the same x-axis: cumulative ballots selected, at full per-pick resolution, not just one point per tier.
Votable options covered % tracks every contest option, undervote, overvote, and write-in-used check, seen on at least one contest-based style. It ramps up fast across Tier 1's picks, since Tier 1 samples the rarest contest-based style/option first, then sits flat at 100%. That's why Round 1 alone is disproportionately valuable.
Strata coverage % only reaches 100% once every contest-based style variant of every votable option has also been verified. It climbs more slowly, across the remaining tiers and rounds.
Each point on the strata curve is labeled with its tier number, matching the Raw Tier Distribution table above.
Both curves show general set-cover progress. They are not specific to any one contest or election, so this shape is what to expect when comparing across different elections' runs.
Full per-pick data, not just tier-end snapshots, is in acre_coverage_curve.csv for building your own visualization.
Margin (votes) / Margin (%): the CVR's own reported margin of victory for that contest, not computed from the ACRE sample.RLA n: simplified risk-limiting-audit sample size (gamma=0, no-error case, risk limit 5%), computed across all ballot types together -- not from the ACRE sample. Uses the DILUTED margin (margin / total ballots with this contest on their style, including genuine blanks/undervotes) as an RLA's sampling universe requires, not the Margin (%) column above (which is undiluted -- margin / votes actually cast, excluding undervotes). Blank if the margin is zero/unknown, or if the contest is out of scope (include_uncontested_contests=False and this contest is uncontested).BMD ballots / Non-BMD ballots: selected ballots covering this contest, by type.BMD contest-based styles / Non-BMD contest-based styles: distinct contest-based styles, across the FULL CVR (not just the selected sample), that carry this contest -- the real denominator behind how many covering ballots to expect (contest-based styles x options is the strata minimum), since a contest can share a rare style family with several other rare contests.BMD primary picks / Non-BMD primary picks: of the covering ballots, how many were selected specifically because of THIS contest's own stratum, as opposed to being covered incidentally (cascade) by a pick made for some other contest on the same contest-based style. Ballots column can run well above contest-based styles x options while primary picks stays near it -- that's cascade coverage from sharing styles with other rare contests, not a bug.BMD write-ins / Non-BMD write-ins: of those, how many happen to carry a write-in in this contest -- not a coverage target (include_writeins default is FALSE), just an observed count.Round reaching RLA n: the earliest review round whose cumulative ballots covering this contest first reach the RLA n column's sample size. Blank if RLA n is unknown, or never reached even at full coverage (common for high-margin contests, where ACRE naturally needs very few ballots). This is a visibility/comparison metric only -- ACRE selects ballots for votable-option coverage, not by the simple random sampling an RLA's risk-limit math requires, so matching the ballot COUNT is not the same as having a valid RLA sample.| Contest | Margin (votes) | Margin (%) | RLA n | Round reaching RLA n | BMD ballots | BMD contest-based styles | BMD primary picks | BMD write-ins | Non-BMD ballots | Non-BMD contest-based styles | Non-BMD primary picks | Non-BMD write-ins |
|---|---|---|---|---|---|---|---|---|---|---|---|---|
| PRESIDENT AND VICE PRESIDENT | 24794 | 73.27 | 3 | 1 | 38 | 4 | 16 | 0 | 44 | 4 | 23 | 0 |
| UNITED STATES SENATOR | 23315 | 74.54 | 3 | 1 | 38 | 4 | 1 | 0 | 44 | 4 | 0 | 0 |
| UNITED STATES SENATOR PARTIAL TERM | 23084 | 74.66 | 3 | 1 | 38 | 4 | 0 | 0 | 44 | 4 | 1 | 0 |
| UNITED STATES REPRESENTATIVE, DISTRICT 2 | 0 | 0 | 0 | 0 | 0 | 0 | 0 | 0 | ||||
| UNITED STATES REPRESENTATIVE, DISTRICT 11 | 22132 | 70.64 | 3 | 1 | 38 | 4 | 1 | 0 | 44 | 4 | 4 | 0 |
| UNITED STATES REPRESENTATIVE, DISTRICT 12 | 0 | 0 | 0 | 0 | 0 | 0 | 0 | 0 | ||||
| UNITED STATES REPRESENTATIVE, DISTRICT 15 | 0 | 0 | 0 | 0 | 0 | 0 | 0 | 0 | ||||
| STATE SENATOR, DISTRICT 7 | 0 | 0 | 0 | 0 | 0 | 0 | 0 | 0 | ||||
| STATE SENATOR, DISTRICT 11 | 21892 | 71.19 | 3 | 1 | 38 | 4 | 0 | 0 | 44 | 4 | 1 | 0 |
| STATE ASSEMBLY MEMBER, DISTRICT 12 | 0 | 0 | 0 | 0 | 0 | 0 | 0 | 0 | ||||
| STATE ASSEMBLY MEMBER, DISTRICT 17 | 15882 | 73.41 | 3 | 1 | 19 | 2 | 0 | 0 | 23 | 2 | 2 | 0 |
| STATE ASSEMBLY MEMBER, DISTRICT 18 | 0 | 0 | 0 | 0 | 0 | 0 | 0 | 0 | ||||
| STATE ASSEMBLY MEMBER, DISTRICT 19 | 2466 | 31.18 | 11 | 1 | 19 | 2 | 0 | 0 | 21 | 2 | 0 | 0 |
| MEMBER, BOARD OF EDUCATION | 1337 | 1.61 | 76 | 2 | 39 | 5 | 10 | 0 | 48 | 5 | 16 | 0 |
| TRUSTEE, COMMUNITY COLLEGE BOARD | 449 | 0.66 | 229 | 38 | 4 | 5 | 0 | 44 | 4 | 3 | 0 | |
| BART BOARD OF DIRECTORS, DISTRICT 7 | 0 | 0 | 0 | 0 | 0 | 0 | 0 | 0 | ||||
| BART BOARD OF DIRECTORS, DISTRICT 9 | 5936 | 25.82 | 15 | 2 | 19 | 2 | 0 | 0 | 22 | 2 | 0 | 0 |
| MAYOR | 645 | 0.53 | 159 | 38 | 4 | 1 | 0 | 2 | 1 | 2 | 0 | |
| PROPOSITION 2 | 22327 | 70.06 | 3 | 1 | 38 | 4 | 0 | 0 | 10 | 1 | 1 | 0 |
| PROPOSITION 3 | 25229 | 77.94 | 3 | 1 | 38 | 4 | 2 | 0 | 10 | 1 | 2 | 0 |
| PROPOSITION 4 | 24240 | 75.56 | 3 | 1 | 38 | 4 | 1 | 0 | 10 | 1 | 1 | 0 |
| PROPOSITION 5 | 16946 | 53.53 | 5 | 1 | 38 | 4 | 0 | 0 | 10 | 1 | 1 | 0 |
| PROPOSITION 6 | 16837 | 53.60 | 5 | 1 | 38 | 4 | 0 | 0 | 10 | 1 | 1 | 0 |
| PROPOSITION 32 | 19533 | 61.18 | 4 | 1 | 38 | 4 | 1 | 0 | 10 | 1 | 1 | 0 |
| PROPOSITION 33 | 1736 | 5.47 | 58 | 38 | 4 | 0 | 0 | 10 | 1 | 1 | 0 | |
| PROPOSITION 34 | 1967 | 6.45 | 51 | 38 | 4 | 0 | 0 | 10 | 1 | 1 | 0 | |
| PROPOSITION 35 | 21518 | 69.15 | 4 | 1 | 38 | 4 | 0 | 0 | 10 | 1 | 0 | 0 |
| PROPOSITION 36 | 3544 | 11.24 | 28 | 2 | 38 | 4 | 0 | 0 | 10 | 1 | 1 | 0 |
| MEASURE A | 21804 | 69.34 | 3 | 1 | 38 | 4 | 0 | 0 | 8 | 1 | 2 | 0 |
| MEASURE B | 21369 | 67.78 | 4 | 1 | 38 | 4 | 0 | 0 | 8 | 1 | 2 | 0 |
| MEASURE C | 8825 | 28.51 | 11 | 1 | 38 | 4 | 0 | 0 | 8 | 1 | 0 | 0 |
| MEASURE D | 5503 | 18.03 | 18 | 1 | 38 | 4 | 0 | 0 | 8 | 1 | 0 | 0 |
| MEASURE E | 4534 | 14.92 | 22 | 2 | 38 | 4 | 0 | 0 | 8 | 1 | 0 | 0 |
| MEASURE F | 3613 | 11.95 | 27 | 2 | 38 | 4 | 0 | 0 | 8 | 1 | 0 | 0 |
| MEASURE G | 11033 | 35.52 | 8 | 1 | 38 | 4 | 1 | 0 | 8 | 1 | 1 | 0 |
| MEASURE H | 4318 | 14.20 | 23 | 2 | 38 | 4 | 0 | 0 | 8 | 1 | 0 | 0 |
| MEASURE I | 18279 | 60.35 | 4 | 1 | 38 | 4 | 1 | 0 | 8 | 1 | 0 | 0 |
| MEASURE J | 23147 | 76.29 | 3 | 1 | 38 | 4 | 0 | 0 | 8 | 1 | 1 | 0 |
| MEASURE K | 13264 | 42.47 | 7 | 1 | 38 | 4 | 1 | 0 | 8 | 1 | 1 | 0 |
| MEASURE L | 8465 | 27.41 | 11 | 1 | 38 | 4 | 0 | 0 | 8 | 1 | 1 | 0 |
| MEASURE M | 12409 | 44.04 | 7 | 1 | 38 | 4 | 0 | 0 | 8 | 1 | 0 | 0 |
| MEASURE N | 4228 | 13.98 | 23 | 2 | 38 | 4 | 0 | 0 | 8 | 1 | 1 | 0 |
| MEASURE O | 24590 | 78.57 | 3 | 1 | 38 | 4 | 0 | 0 | 8 | 1 | 1 | 0 |