Run Date: 2026-08-06 02:57:56.399960 Copyright (c) Citizens' Oversight
This report is the result by AuditEngine compared with the official Cast Vote Records (CVR), when those records are available. If not, then the report reflects the evaluation of the election by AuditEngine including reports of variants detected, such as write-ins, overvotes, and gray-flags.
The following table summarizes what is compared and any limitations. This is a general description which is not modified for this specific case:
| Source | Description |
|---|---|
| Audit | The tabulation by AuditEngine without reference to the official CVR. |
| CVR | If available, the CVR provides the official results by the voting system. This result may contain adjudications by election staff |
| Adjud. Audit | Results of the audit with adjudications applied from the AdjudiTally app |
| Official Results | Aggregated Results for each contest captured from parsed reports or manually entered. |
| Manual Count | Manual counts from any manual counting activities that include all ballots for a contest of interest |
One of the key differences between ballot image audits by AuditEngine and other types of auditing, is that the comparison occur for all ballots at the ballot level, between the results from AuditEngine and the official results
Sheets -- Each ballot image comprises a single paper sheet, including both sides. This is the case even if multiple sheets are included in the logical ballot. Individual ballot sheets will include a number of contests. NOTE: Depending on the number of sheets included in a single logical ballot, the number of ballots cast may be less than the total number of sheets, and it may be hard to predict because subsequent sheets are commonly not included in the logical ballot cast. Counting the first sheet will usually produce a pretty accurate number, but even then, some voters do not include the first sheet either.
Contest or Ballot-Contest -- A single contest on a single ballot is a "ballot-contest" and sometimes just "contest" in this context. This is not the entire contest with all votes from all ballots summed, but simply the evaluation of that single contest on that sheet. Frequently, these can be called "votes", except that sometimes a single contest will allow multiple votes.
Write-in -- If the write-in oval is marked or if the write-in area is filled in, then it is considered that the voter intent is to write-in the name for some other candidate.
How this is handled is specific to different states, but most often, the written-in name must also be from a list of
qualified write-in candidates.
Write-ins on BMD ballots do not need human-eye adjudication at this stage because the names are keyed in.
The name written-in should be examined in close contests even if there were no candidates that were qualified
for this contest, because the name written-in may be of a listed candidate, and if so, then the vote is accepted
for that listed candidate.
Write-ins normally account for about 80% of Contest Variants. At this stage, most jurisdictions do not fully
filter whether the name written-in is a qualified write-in candidate, but may do so during adjudication.
Overvotes -- One overvote occurs when more than the "vote-for" number are selected. Overvotes do not happen on BMD ballots. Very frequently, overvotes are misinterpreted by the voting system and should be fully reviewed in close contests. If a contests has an overvote, it will be first classified as an overvote, even when the write-in target is selected. Some election departments will mark overvotes as an undervote when they are confirmed as an overvote. AuditEngine understands this form of adjudication and does not regard it as a disagreement.
AuditEngine will correctly interpret many marks that would be considered undervotes by voting systems, such as when ovals are circled or if a checkmark does not actually get inside the oval.
Adjudicated -- For some voting systems, such as Dominion, the CVR may provide not only the original evaluation of the ballot sheet, but also a 'modified' record which includes all contests on the ballot. The 'modified' record may modify zero or many contests after human-eye review by election staff. If the modified record does not show a change in a given contest, it is not possible to know from that record if the contest was inspected and confirmed or not.
AuditEngine also provides for adjudication of its evaluation using the AdjudiTally App. The results of the adjudication will be included in the analysis of the results. Any official hand counts can also be included in the comparison results.
Disagreed -- a contest is considered "disagreed" unless the voting system and AuditEngine fully agree on the outcome, including whether it was overvoted, undervoted, or had write-ins. Since write-ins and overvotes are frequently reviewed and adjudicated by election staff, disagreed write-ins and overvotes are treated together in terms of analysis. "Normal Disagreed" are the rest of the disagreed, which are not write-ins or overvotes.
Non-Variant Sheets -- A ballot sheet is classified as Non-Variant if it has no write-ins, overvotes, and gray-flags, and if compared, every contest fully agrees between the evaluation of the voting system and AuditEngine. Such sheets are maintained as a single record but keep track of the number and which contests are on them.
Variant Removed Sheets -- If a ballot sheet has at least one contest-variant detected, then that contest variant is logically pulled from this comparison record, and what remains are the rest of the non-variant contests. Note that if all contests are considered contest-variants, then it will be an empty shell with no contests left in it, and all contest variants will be moved to the contest-variants set.
Contest Variants -- A contest variant is a ballot-contest which has write-ins, overvotes, is gray-flagged, or if it is 'disagreed', i.e. if there is any disagreement between the evaluation of the vote by AuditEngine and the official result (if a comparison is performed). Undervotes are not included in the set unless they are disagreed. Contest Variants can normally be summed by contest. Each contest variant has a separate record for each ballot-contest instance.
Unprocessed -- Unprocessed sheets are those that were NOT successfully processed by AuditEngine. These are generally due to images that are damaged due to 'stretching' of the image when the sheet is not evenly fed through the scanner, barcodes that were corrupted and unreliable, or BMD ballots that were not perfectly read using OCR. Cleaning the scanner rollers can help to avoid corrupted images. AuditEngine does not track contests on unprocessed sheets.
Ballot Variant -- If a complete sheet is blank or if the image was detected as corrupted, then this is classified as a ballot-variant.
Images Missing -- Sometimes we can't access all the images and so these are accounted for as images missing. AuditEngine does not attempt to sum the contests on ballot images that are missing.
| parameter | images | cvrs | images-cvrs | results | results-images |
|---|---|---|---|---|---|
| num_files | 2 | 2 | 0 | 0 | 0 |
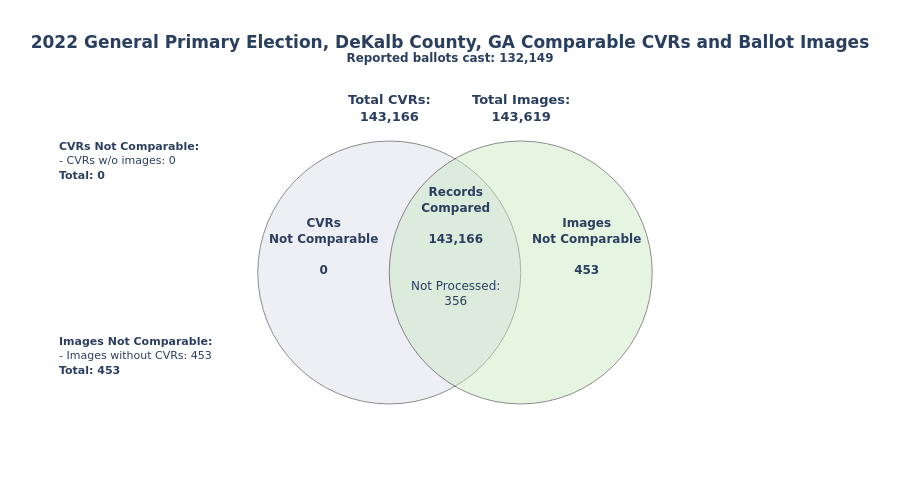
| raw_total | 143,619 | 143,166 | 453 | 132,149 | -11,470 |
| repeated ballot_ids | 0 | 0 | 0 | 0 | 0 |
| net unique ballot_ids | 143,619 | 143,166 | 453 | 132,149 | -11,470 |
| net unique BMD Ballots | 128,318 | 0 | 0 | 0 | 0 |
| repeated sheets | 0 | 0 | 0 | 0 | 0 |
| repeated BMD Ballots | 0 | 0 | 0 | 0 | 0 |
| repeated nonBMD Ballots | 0 | 0 | 0 | 0 | 0 |
| repeated residue | 0 | 0 | 0 | 0 | 0 |
| net unique sheets | 143,619 | 143,166 | 453 | 132,149 | -11,470 |
| net unique sheets in common | 143,166 | 143,166 | 0 | 0 | 0 |
| net unique sheets not in common | 453 | 0 | 0 | 0 | 0 |
| Parameter | Value |
|---|---|
| Election Name | 2022 General Primary Election, DeKalb County, GA |
| Official Ballots Cast | 132,149 |
| Number of precincts | 136 |
| Number of parties | 0 |
| Number of contests | 108 |
| Number of styles | 999 |
| Number of hexstyles (patterns of contests) | 239 |
| Number of BMD ballots | 128,318 |
| Number of different sheets | 2 |
| ---- Ballot Image Archives (BIAs) ---- | -------------------- |
| Number of BIA Ballot Archives | 2 |
| Unique ballot_ids in BIAs | 143,619 |
| Total number of records in BIAs | 143,619 |
| Num. kept repeated ballot_ids in BIAs | 0 |
| Num. skipped repeated ballot_ids in BIAs | 0 |
| Num. skipped repeated images | 0 |
| BIA_num (unique images) | 143,619 |
| cast_num == BIA_num? | False |
| ballots cast > BIA by | 0 |
| ballots in BIA > cast by | 11,470 |
| ---- Cast Vote Records (CVRs) ---- | -------------------- |
| Number of CVR files | 2 |
| Unique ballot_ids in CVRs | 143,166 |
| Total number of CVR records | 143,166 |
| Number of repeated CVR ballot_ids | 0 |
| Number of CVR records with multiple cards | 0 |
| ballotids in CVR == BIA? | False |
| ballotids in BIA not in CVR | 453 |
| ballotids in CVR not in BIA | 0 |
| ballotids in CVR and also in BIA | 143,166 |
| ballotids in CVR or in BIA (union) | 143,619 |
| ---- Metadata from Images (BLTs) ---- | -------------------- |
| BLT_unique_ballots_num | 143,619 |
| Total number of BLT bif records | 143,619 |
| Duplicate BLT ballot_ids | 0 |
| ballotids in BLT == BIA? | True |
| ballots cast not in BLT | -11,470 |
| Number of card_codes | 851 |
| Number of ballots with no card_codes | 128,773 |
| Number of corrupted ballots | 453 |
| Sheet | Count |
|---|---|
| 0 | 133,375 |
| 1 | 9,791 |
This first section is an election-wide review of the ballots that are considered
| Record Type | Sheets | Ballot Contests |
% of Sheets | % of Contests | Description |
|---|---|---|---|---|---|
Non-Variant Sheets |
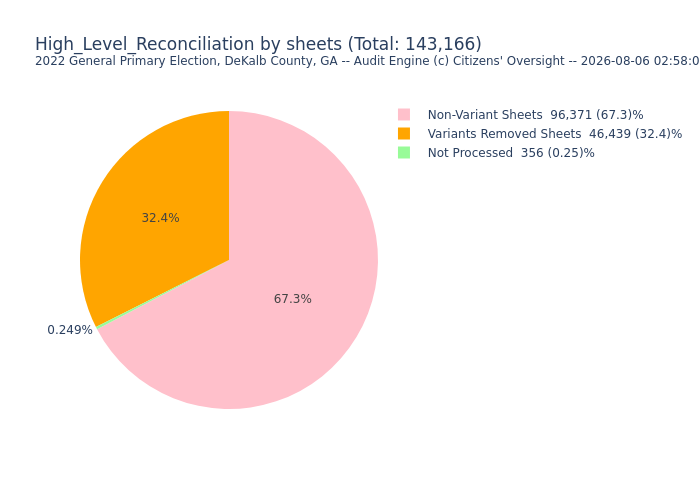
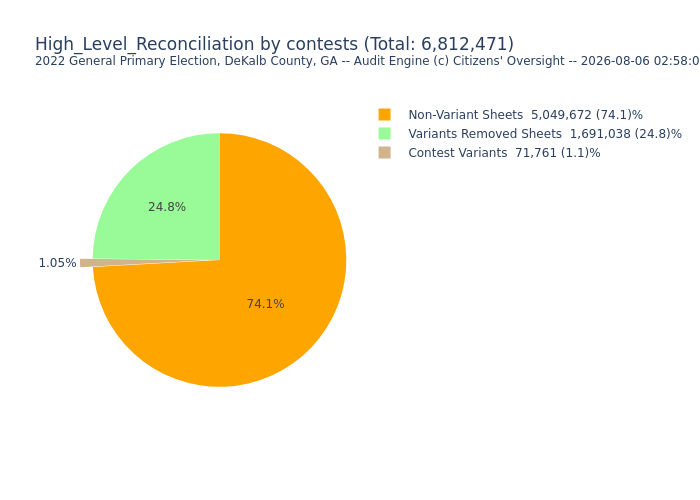
96,371 | 5,049,672 | 67.5% | 74.1% | Ballot sheets which have no contest variants at all. Thus, they have no overvotes, write-ins or any gray-flags, and if compared, the evaluations by AuditEngine and the voting system are identical. Please note that undervotes are frequently present and are not considered a reported variation. |
Variants Removed Sheets |
46,439 | 1,691,038 | 32.5% | 24.8% | Records of ballot sheets which originally contained variant contests, but where those variant contests have been logically 'removed' from the number of contests that remain on the sheets. The remaining contests and sheets listed here are 'agreed' and have no overvotes, writeins or gray_flags. The number of contests listed in this group are those that remain and are all plain (non-variant). |
Subtotal Agreed |
142,810 | 6,740,710 | 100.0% | 98.9% | Total agreed or partially agreed sheets and total of agreed ballot-contests. These counts are accurate for both Sheets and Contests. |
Contest Variants |
- - | 71,761 | 32.4% | 1.1% | Ballot-Contests logically removed from Variants Removed Sheets that have variations at the contest level. These will be further broken down based on the reason for the variation. Contest Variants includes those contests with write-ins, overvotes, gray-flags, and disagreements when the evaluation is compared between that of AuditEngine and the voting system, and are not included in Non-Variant and Variants Removed Sheets, because they are logically removed. |
Not Processed |
356 | - - - | 0.25% | 0.0% | Ballots that were NOT successfully processed by AuditEngine. These are generally due to images that are distorted due to 'stretching' of the image when the page is not evenly fed through the scanner, barcodes that were corrupted and unreliable, or BMD ballots that were not perfectly read using OCR. Cleaning or replacing the scanner rollers can help to avoid distorted images. See Unprocessed Ballots Report for details. Ex: 05012_00002_000001, 05012_00002_000002, 05012_00002_000003, 05012_00002_000004, 05012_00002_000005, 05012_00002_000007, 05012_00002_000008, 05012_00002_000009, 05012_00002_000010, 05012_00002_000011 |
Ballot Variants |
- | - | 0.0% | 0.0% | Ballot sheets that have deviations at the ballot level, style mismatch, no-cvr, or blank). |
Images Missing |
0 | - - - | 0.0% | 0.0% | Ballots that exist in the CVR but are not available as ballot images. |
| Total | 142,810 | 6,812,471 |
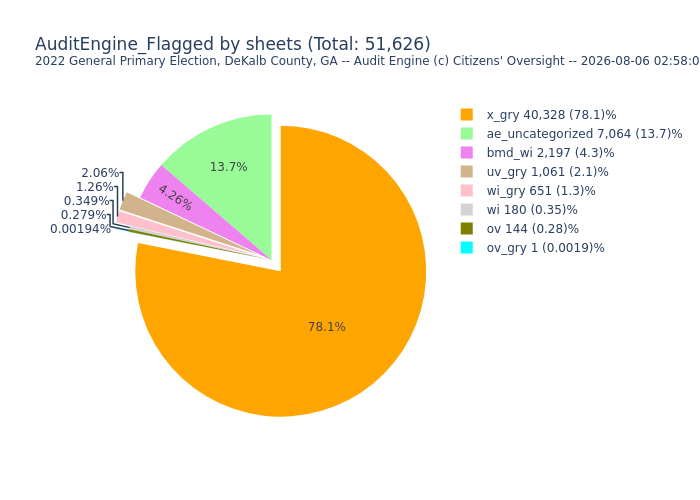
If no CVR is available for comparison, then these groups are used to drive adjudication to fine tune the result from AuditEngine. These sets only include ballots with images.
The group 'ae_uncategorized' were classified as variants based on cvr comparison and not included in the cases detected without any cvr comparison. It is common for this to be a fairly large number of variants. These are analyzed separately below.
| Record Type | Sheets | Ballot Contests |
% of Sheets | % of Contests | Description |
|---|---|---|---|---|---|
| wi | 180 | 389 | 0.35% | 0.54% | Audit Writeins: Contests per AuditEngine that have writeins and are NOT flagged as 'gray' (NO BMDs). |
| bmd_wi | 2,197 | 5,350 | 4.3% | 7.5% | Audit Writeins: Contests per AuditEngine that have writeins and are NOT flagged as 'gray' (BMDs only). |
| wi_gry | 651 | 702 | 1.3% | 0.98% | Audit Writeins: Contests per AuditEngine that have writeins and ARE flagged as 'gray' (may be BMDs). |
| ov | 144 | 158 | 0.28% | 0.22% | Audit Overvotes: Contests per AuditEngine that are overvoted, are not writeins, and are NOT flagged as 'gray'. |
| ov_gry | 1 | 3 | 0.0019% | 0.0042% | Audit Overvotes: Contests per AuditEngine that are overvoted, and ARE flagged as 'gray'. |
| uv_gry | 1,061 | 1,925 | 2.1% | 2.7% | Audit Undervotes: Contests per AuditEngine that are undervoted, and ARE flagged as 'gray'. |
| x_gry | 40,328 | 54,383 | 78.1% | 75.8% | Contests flagged as 'gray' by AuditEngine for further review, and do not include writeins or overvotes or undervotes. |
| ae_uncategorized | 7,064 | 8,851 | 13.7% | 12.3% | These contest variants are not independently flagged by AuditEngine but are considered variant due to cvr comparison. |
| Total | 51,626 | 71,761 |
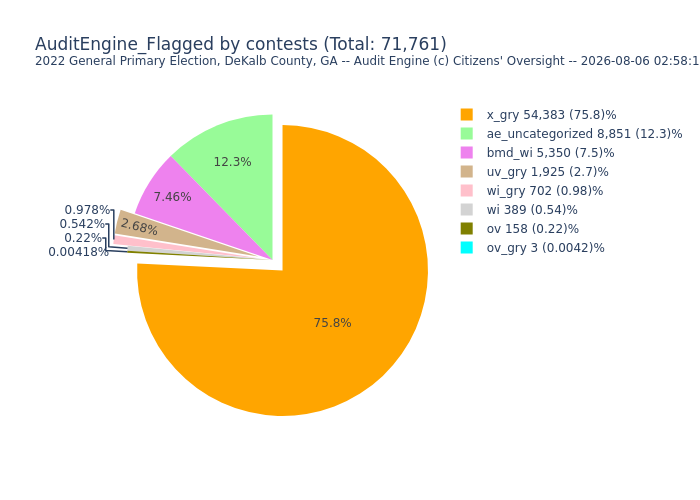
This high-level breakdown is based on AuditEngine evaluation.
| Record Type | Sheets | Ballot Contests |
% of Sheets | % of Contests | Description |
|---|---|---|---|---|---|
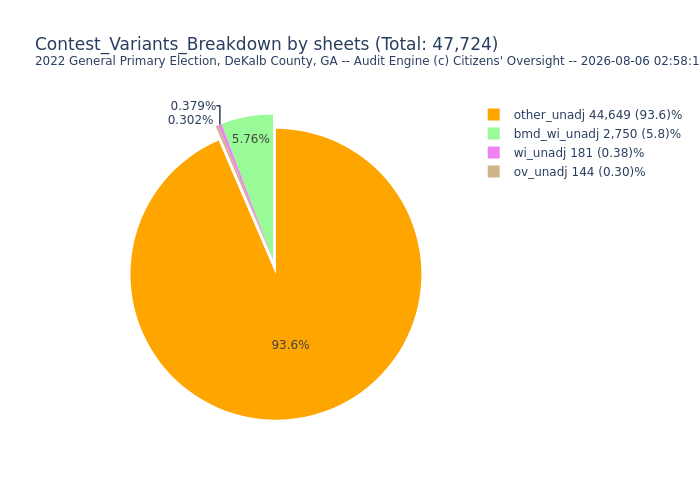
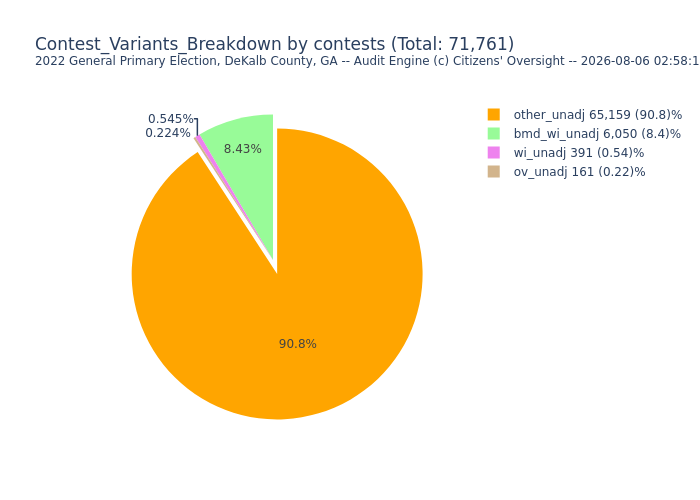
| wi_unadj | 181 | 391 | 0.38% | 0.54% | Writeins per AuditEngine, unadjudicated (No BMDs). |
| bmd_wi_unadj | 2,750 | 6,050 | 5.8% | 8.4% | Writeins per AuditEngine, unadjudicated (BMDs only). |
| ov_unadj | 144 | 161 | 0.30% | 0.22% | Overvotes per AuditEngine, unadjudicated. |
| other_unadj | 44,649 | 65,159 | 93.6% | 90.8% | True discrepancies not including writeins, or overvotes, unadjudicated. |
| cv2_uncategorized | - | - | 0.0% | 0.0% | Any uncategorized cv1 groups |
| Total | 47,724 | 71,761 |
| include_bmd_ballot_type | True |
| include_nonbmd_ballot_type | True |
| cmpcvr_report_agreed_overvotes | False |
| save_variant_ballots | True |
| accept_adjudicated_writeins | True |
This report is the most revealing in terms of possible changes in the outcome of any contests. General terms (Write-in, Overvotes, Disagreed, etc.) are covered under Definitions above; this table's own columns have some additional meaning specific to it, covered below.
The shortlist below narrows this down to the contests most worth reviewing first. The complete table for every contest follows further down, for reference.
Total: Total ballots cast which included this contest with images that were processed by AuditEngine.
NonVariant: Instances of this contest without write-ins, overvotes, and were not flagged as 'gray', and if compared, where the official outcome and the evaluation by AuditEngine agreed.
Undervotes: Undervotes are very numerous and are not included in the discrepancy report unless they are disagreed or gray flagged.
Gray Only: Instances of this contest where AuditEngine detected an ambiguous mark or used heuristics to decide voter-intent. This column omits any ballots which are already in the columns for write-ins, overvotes, or disagreed ballots, even if AuditEngine internally flags them as gray.
All Variants: Ballots with Overvotes, Write-ins, Gray Flagged, or if compared, are disagreed. The number of ballot sheets cast should equal the sum of "Non-Variant", and "All Variants". The components of this column are highlighted.
Disagreed% of Margin This provides a good measure of whether the variants may have any impact on the outcome, and the highest 5 values are highlighted. Further analysis is still required to see if the disagreements will reduce the current margin of victory.
Variant% of Margin This provides a maximum measure of whether the variants may have any impact on the outcome, and the highest 5 values are highlighted, and any contest with variant% over 10%. Typically, the vast majority (perhaps 90%) of All Variants are Agreed Write-ins and Agreed Overvotes which may only rarely result in any changes in the outcome.
Vote Margin: This is the margin of victory, i.e. gap between votes for runner-up and winner (lowest winner if contest has multiple winners) among the ballots processed, and may be a subset of the total margin for the entire district if AuditEngine did not receive or process all ballot images.
To reduce the report size, precinct details are limited to the first few contests or those contests that were highlighted or are included in the setting 'cmpcvr_report_include_contests'. If you are interested in a specific contest, include it in the setting 'cmpcvr_report_include_contests', which is a list.
Start here. This narrows the full table below down to only those contests which were the most concerning when variants and disagreements were compared with the margin of victory.
| Contest | Total | Agreed & NonVariant |
Agreed Overvotes |
Agreed Write-ins |
No CVR |
Gray Only |
Disagreed | All Variants |
Disagreed% of Margin |
Variant% of Margin |
Vote Margin |
Margin% |
|---|---|---|---|---|---|---|---|---|---|---|---|---|
| US House of Representatives - District 4 - Dem | 72,405 | 57,698 | 0 | 0 | 0 | 14,707 | 0 | 14,707 | 0.00% | 21.75% | 67,625 | 100.00% |
| County Commissioner D2 - Dem | 18,648 | 13,683 | 1 | 0 | 0 | 1 | 4,964 | 4,965 | 764.87% | 765.02% | 649 | 4.61% |
| Board of Education D2 | 18,018 | 17,618 | 11 | 2 | 0 | 39 | 286 | 400 | 118.18% | 165.29% | 242 | 1.74% |
| Board of Education D4 | 18,129 | 17,709 | 1 | 2 | 0 | 14 | 359 | 420 | 8.80% | 10.30% | 4,079 | 26.51% |
| Board of Education D6 | 16,321 | 15,966 | 2 | 2 | 0 | 11 | 317 | 355 | 10.63% | 11.90% | 2,983 | 19.77% |
| Atlanta Public Improvement Bond (Public Safety, Parks and Rec) | 9,223 | 425 | 0 | 0 | 0 | 7,496 | 1,302 | 8,798 | 18.49% | 124.92% | 7,043 | 79.00% |
| Contest | Total | Agreed & NonVariant |
Agreed Overvotes |
Agreed Write-ins |
No CVR |
Gray Only |
Disagreed | All Variants |
Disagreed% of Margin |
Variant% of Margin |
Vote Margin |
Margin% |
|---|---|---|---|---|---|---|---|---|---|---|---|---|
| US Senate - Rep | 30,788 | 30,780 | 0 | 0 | 0 | 8 | 0 | 8 | 0.00% | 0.08% | 9,472 | 32.22% |
| US Senate - Dem | 102,244 | 102,231 | 2 | 0 | 0 | 11 | 2 | 13 | 0.00% | 0.01% | 96,090 | 94.67% |
| Governor - Rep | 30,787 | 30,778 | 1 | 0 | 0 | 6 | 3 | 9 | 0.01% | 0.04% | 20,523 | 66.88% |
| Governor - Dem | 102,208 | 102,192 | 0 | 0 | 0 | 14 | 2 | 16 | 0.00% | 0.02% | 101,101 | 100.00% |
| Lieutenant Governor - Rep | 30,787 | 30,775 | 1 | 0 | 0 | 8 | 4 | 12 | 0.16% | 0.49% | 2,449 | 9.02% |
| Lieutenant Governor - Dem | 102,208 | 102,127 | 40 | 0 | 0 | 39 | 42 | 81 | 0.32% | 0.61% | 13,266 | 13.74% |
| Secretary of State - Rep | 30,787 | 30,742 | 1 | 0 | 0 | 43 | 2 | 45 | 0.01% | 0.32% | 14,083 | 46.97% |
| Secretary of State - Dem | 102,208 | 102,133 | 5 | 0 | 0 | 68 | 7 | 75 | 0.02% | 0.18% | 42,519 | 43.37% |
| Attorney General - Rep | 30,787 | 30,756 | 0 | 0 | 0 | 31 | 0 | 31 | 0.00% | 0.21% | 14,844 | 52.90% |
| Attorney General - Dem | 102,208 | 102,195 | 0 | 0 | 0 | 12 | 1 | 13 | 0.00% | 0.02% | 61,266 | 64.00% |
| Commissioner of Agriculture - Rep | 30,787 | 30,784 | 0 | 0 | 0 | 2 | 1 | 3 | 0.00% | 0.01% | 22,499 | 100.00% |
| Commissioner of Agriculture - Dem | 102,208 | 102,192 | 0 | 0 | 0 | 16 | 0 | 16 | 0.00% | 0.06% | 27,907 | 30.42% |
| Commissioner of Insurance - Rep | 30,787 | 30,778 | 3 | 0 | 0 | 6 | 3 | 9 | 0.02% | 0.06% | 14,715 | 55.46% |
| Commissioner of Insurance - Dem | 102,208 | 102,172 | 0 | 0 | 0 | 34 | 2 | 36 | 0.01% | 0.20% | 18,453 | 19.99% |
| State School Superintendent - Rep | 30,787 | 30,779 | 0 | 0 | 0 | 7 | 1 | 8 | 0.01% | 0.09% | 9,057 | 34.55% |
| State School Superintendent - Dem | 102,208 | 102,181 | 2 | 0 | 0 | 25 | 2 | 27 | 0.01% | 0.07% | 39,377 | 42.71% |
| Commissioner of Labor - Rep | 30,787 | 30,780 | 1 | 0 | 0 | 6 | 1 | 7 | 0.02% | 0.13% | 5,237 | 22.78% |
| Commissioner of Labor - Dem | 102,208 | 102,152 | 4 | 0 | 0 | 50 | 6 | 56 | 0.68% | 6.33% | 884 | 0.97% |
| PSC - District 2 - Rep | 30,787 | 30,785 | 0 | 0 | 0 | 2 | 0 | 2 | 0.00% | 0.01% | 22,637 | 100.00% |
| PSC - District 2 - Dem | 102,208 | 102,201 | 1 | 0 | 0 | 6 | 1 | 7 | 0.00% | 0.02% | 28,142 | 31.74% |
| PSC - District 3 - Rep | 30,787 | 30,784 | 0 | 0 | 0 | 3 | 0 | 3 | 0.00% | 0.01% | 21,734 | 100.00% |
| PSC - District 3 - Dem | 102,208 | 102,187 | 1 | 0 | 0 | 20 | 1 | 21 | 0.01% | 0.15% | 14,280 | 16.00% |
| US House of Representatives - District 4 - Rep | 26,027 | 26,021 | 1 | 0 | 0 | 5 | 1 | 6 | 0.01% | 0.06% | 10,358 | 52.24% |
| US House of Representatives - District 4 - Dem | 72,405 | 57,698 | 0 | 0 | 0 | 14,707 | 0 | 14,707 | 0.00% | 21.75% | 67,625 | 100.00% |
| US House of Representatives - District 5 - Rep | 4,761 | 4,761 | 0 | 0 | 0 | 0 | 0 | 0 | 0.00% | 0.00% | 2,904 | 100.00% |
| US House of Representatives - District 5 - Dem | 29,839 | 29,817 | 15 | 0 | 0 | 7 | 15 | 22 | 0.07% | 0.10% | 21,853 | 77.85% |
| State Senate - District 10 - Dem | 15,785 | 15,784 | 0 | 0 | 0 | 1 | 0 | 1 | 0.00% | 0.01% | 7,275 | 48.39% |
| State Senate - District 40 - Rep | 13,413 | 13,411 | 0 | 0 | 0 | 2 | 0 | 2 | 0.00% | 0.02% | 9,442 | 100.00% |
| State Senate - District 40 - Dem | 10,905 | 10,904 | 0 | 0 | 0 | 1 | 0 | 1 | 0.00% | 0.01% | 9,842 | 100.00% |
| State Senate - District 41 - Rep | 6,013 | 6,013 | 0 | 0 | 0 | 0 | 0 | 0 | 0.00% | 0.00% | 4,158 | 100.00% |
| State Senate - District 41 - Dem | 20,921 | 20,919 | 0 | 0 | 0 | 2 | 0 | 2 | 0.00% | 0.01% | 18,577 | 100.00% |
| State Senate - District 42 - Dem | 29,320 | 29,319 | 0 | 0 | 0 | 1 | 0 | 1 | 0.00% | 0.00% | 26,096 | 100.00% |
| State Senate - District 43 - Rep | 281 | 281 | 0 | 0 | 0 | 0 | 0 | 0 | 0.00% | 0.00% | 216 | 100.00% |
| State Senate - District 43 - Dem | 4,280 | 4,279 | 0 | 0 | 0 | 1 | 0 | 1 | 0.00% | 0.03% | 3,268 | 80.85% |
| State Senate - District 44 - Dem | 9,455 | 9,455 | 0 | 0 | 0 | 0 | 0 | 0 | 0.00% | 0.00% | 6,947 | 78.01% |
| State Senate - District 55 - Dem | 11,542 | 11,542 | 0 | 0 | 0 | 0 | 0 | 0 | 0.00% | 0.00% | 6,678 | 60.33% |
| State House of Representatives - District 52 - Rep | 2,760 | 2,760 | 0 | 0 | 0 | 0 | 0 | 0 | 0.00% | 0.00% | 1,879 | 100.00% |
| State House of Representatives - District 52 - Dem | 2,065 | 2,065 | 0 | 0 | 0 | 0 | 0 | 0 | 0.00% | 0.00% | 1,808 | 100.00% |
| State House of Representatives - District 80 - Rep | 5,934 | 5,934 | 0 | 0 | 0 | 0 | 0 | 0 | 0.00% | 0.00% | 4,256 | 100.00% |
| State House of Representatives - District 80 - Dem | 3,724 | 3,724 | 0 | 0 | 0 | 0 | 0 | 0 | 0.00% | 0.00% | 3,240 | 100.00% |
| State House of Representatives - District 81 - Rep | 5,075 | 5,074 | 0 | 0 | 0 | 0 | 1 | 1 | 0.03% | 0.03% | 3,383 | 100.00% |
| State House of Representatives - District 81 - Dem | 5,768 | 5,767 | 0 | 0 | 0 | 1 | 0 | 1 | 0.00% | 0.02% | 5,147 | 100.00% |
| State House of Representatives - District 82 - Rep | 3,827 | 3,827 | 0 | 0 | 0 | 0 | 0 | 0 | 0.00% | 0.00% | 2,382 | 100.00% |
| State House of Representatives - District 82 - Dem | 8,409 | 8,409 | 0 | 0 | 0 | 0 | 0 | 0 | 0.00% | 0.00% | 7,635 | 100.00% |
| State House of Representatives - District 83 - Rep | 3,440 | 3,440 | 0 | 0 | 0 | 0 | 0 | 0 | 0.00% | 0.00% | 2,427 | 100.00% |
| State House of Representatives - District 83 - Dem | 3,273 | 3,273 | 0 | 0 | 0 | 0 | 0 | 0 | 0.00% | 0.00% | 2,860 | 100.00% |
| State House of Representatives - District 84 - Dem | 12,819 | 12,814 | 0 | 0 | 0 | 5 | 0 | 5 | 0.00% | 0.07% | 7,353 | 63.24% |
| State House of Representatives - District 85 - Dem | 6,997 | 6,996 | 0 | 0 | 0 | 1 | 0 | 1 | 0.00% | 0.03% | 3,066 | 47.71% |
| State House of Representatives - District 86 - Rep | 919 | 919 | 0 | 0 | 0 | 0 | 0 | 0 | 0.00% | 0.00% | 632 | 100.00% |
| State House of Representatives - District 86 - Dem | 6,958 | 6,957 | 0 | 0 | 0 | 1 | 0 | 1 | 0.00% | 0.53% | 190 | 2.97% |
| State House of Representatives - District 87 - Dem | 7,250 | 7,250 | 0 | 0 | 0 | 0 | 0 | 0 | 0.00% | 0.00% | 6,739 | 100.00% |
| State House of Representatives - District 88 - Rep | 1,945 | 1,944 | 0 | 0 | 0 | 0 | 1 | 1 | 0.07% | 0.07% | 1,335 | 100.00% |
| State House of Representatives - District 88 - Dem | 6,873 | 6,873 | 0 | 0 | 0 | 0 | 0 | 0 | 0.00% | 0.00% | 2,035 | 31.11% |
| State House of Representatives - District 89 - Rep | 1,649 | 1,649 | 0 | 0 | 0 | 0 | 0 | 0 | 0.00% | 0.00% | 991 | 100.00% |
| State House of Representatives - District 89 - Dem | 11,120 | 11,120 | 0 | 0 | 0 | 0 | 0 | 0 | 0.00% | 0.00% | 10,065 | 100.00% |
| State House of Representatives - District 90 - Rep | 1,092 | 1,091 | 0 | 0 | 0 | 1 | 0 | 1 | 0.00% | 0.15% | 666 | 100.00% |
| State House of Representatives - District 90 - Dem | 12,316 | 12,310 | 3 | 0 | 0 | 3 | 3 | 6 | 0.33% | 0.66% | 911 | 8.10% |
| State House of Representatives - District 91 - Dem | 3,696 | 3,696 | 0 | 0 | 0 | 0 | 0 | 0 | 0.00% | 0.00% | 2,760 | 78.41% |
| State House of Representatives - District 92 - Dem | 2,269 | 2,269 | 0 | 0 | 0 | 0 | 0 | 0 | 0.00% | 0.00% | 1,523 | 71.94% |
| State House of Representatives - District 93 - Dem | 956 | 955 | 0 | 0 | 0 | 1 | 0 | 1 | 0.00% | 0.19% | 521 | 57.06% |
| State House of Representatives - District 94 - Dem | 5,436 | 5,436 | 0 | 0 | 0 | 0 | 0 | 0 | 0.00% | 0.00% | 5,016 | 100.00% |
| State House of Representatives - District 95 - Rep | 156 | 156 | 0 | 0 | 0 | 0 | 0 | 0 | 0.00% | 0.00% | 107 | 100.00% |
| State House of Representatives - District 95 - Dem | 2,279 | 2,279 | 0 | 0 | 0 | 0 | 0 | 0 | 0.00% | 0.00% | 2,092 | 100.00% |
| County Commissioner D2 - Dem | 18,648 | 13,683 | 1 | 0 | 0 | 1 | 4,964 | 4,965 | 764.87% | 765.02% | 649 | 4.61% |
| County Commissioner D3 - Dem | 29,402 | 29,393 | 0 | 0 | 0 | 9 | 0 | 9 | 0.00% | 0.06% | 15,852 | 57.71% |
| County Commissioner D7 - Dem | 56,374 | 56,349 | 8 | 0 | 0 | 17 | 8 | 25 | 0.02% | 0.08% | 32,378 | 61.13% |
| Rep Party Question 1 | 30,785 | 30,762 | 1 | 0 | 0 | 22 | 1 | 23 | 0.01% | 0.14% | 16,763 | 56.36% |
| Rep Party Question 2 | 30,785 | 30,750 | 0 | 0 | 0 | 35 | 0 | 35 | 0.00% | 0.25% | 14,055 | 47.45% |
| Rep Party Question 3 | 30,785 | 30,749 | 0 | 0 | 0 | 34 | 2 | 36 | 0.02% | 0.33% | 10,769 | 37.19% |
| Rep Party Question 4 | 30,785 | 30,769 | 0 | 0 | 0 | 16 | 0 | 16 | 0.00% | 0.09% | 17,695 | 62.40% |
| Rep Party Question 5 | 30,785 | 30,703 | 0 | 0 | 0 | 82 | 0 | 82 | 0.00% | 0.37% | 22,096 | 74.95% |
| Rep Party Question 6 | 30,785 | 30,763 | 0 | 0 | 0 | 22 | 0 | 22 | 0.00% | 0.11% | 19,510 | 66.92% |
| Rep Party Question 7 | 30,785 | 30,737 | 0 | 0 | 0 | 47 | 1 | 48 | 0.01% | 0.62% | 7,769 | 26.31% |
| Rep Party Question 8 | 30,785 | 30,745 | 1 | 0 | 0 | 39 | 1 | 40 | 0.01% | 0.26% | 15,268 | 52.02% |
| Rep Party Question 9 (Local) | 30,785 | 30,734 | 0 | 0 | 0 | 51 | 0 | 51 | 0.00% | 0.91% | 5,604 | 19.27% |
| Rep Party Question 10 (Local) | 30,785 | 30,683 | 0 | 0 | 0 | 102 | 0 | 102 | 0.00% | 0.64% | 15,921 | 54.83% |
| Rep Party Question 11 (Local) | 30,785 | 30,697 | 0 | 0 | 0 | 87 | 1 | 88 | 0.01% | 0.56% | 15,762 | 54.56% |
| Rep Party Question 12 (Local) | 30,785 | 30,752 | 1 | 0 | 0 | 31 | 2 | 33 | 0.02% | 0.27% | 12,346 | 43.13% |
| Rep Party Question 13 (Local) | 30,785 | 30,747 | 0 | 0 | 0 | 36 | 2 | 38 | 0.01% | 0.27% | 14,233 | 49.19% |
| Dem Party Question 1 | 102,209 | 102,059 | 2 | 0 | 0 | 144 | 6 | 150 | 0.01% | 0.21% | 70,593 | 70.06% |
| Dem Party Question 2 | 102,209 | 102,107 | 0 | 0 | 0 | 92 | 10 | 102 | 0.01% | 0.11% | 94,498 | 93.38% |
| Dem Party Question 3 | 102,209 | 102,143 | 2 | 0 | 0 | 62 | 4 | 66 | 0.00% | 0.07% | 95,449 | 94.26% |
| Dem Party Question 4 | 102,209 | 102,096 | 0 | 0 | 0 | 111 | 2 | 113 | 0.00% | 0.15% | 76,777 | 77.29% |
| Dem Party Question 5 | 102,209 | 102,106 | 1 | 0 | 0 | 100 | 3 | 103 | 0.00% | 0.13% | 80,199 | 79.75% |
| Dem Party Question 6 | 102,209 | 102,101 | 1 | 0 | 0 | 107 | 1 | 108 | 0.00% | 0.11% | 97,251 | 96.15% |
| Dem Party Question 7 | 102,209 | 102,094 | 1 | 0 | 0 | 111 | 4 | 115 | 0.00% | 0.12% | 95,336 | 94.32% |
| Dem Party Question 8 | 102,209 | 102,062 | 0 | 0 | 0 | 145 | 2 | 147 | 0.00% | 0.21% | 68,596 | 68.12% |
| Dem Party Question 9 | 102,209 | 102,109 | 0 | 0 | 0 | 99 | 1 | 100 | 0.00% | 0.10% | 96,274 | 95.71% |
| Justice - Supreme Court of Georgia (Colvin) | 135,379 | 134,816 | 6 | 6 | 0 | 29 | 11 | 563 | 0.03% | 1.49% | 37,910 | 32.48% |
| Justice - Supreme Court of Georgia (LaGrua) | 135,379 | 134,397 | 3 | 51 | 0 | 27 | 6 | 982 | 0.01% | 0.89% | 110,469 | 100.00% |
| Justice - Supreme Court of Georgia (McMillian) | 135,379 | 134,536 | 4 | 37 | 0 | 138 | 6 | 843 | 0.01% | 0.76% | 110,567 | 100.00% |
| Judge - Court of Appeals of Georgia (Barnes) | 135,379 | 128,890 | 2 | 35 | 0 | 5,926 | 23 | 6,489 | 0.02% | 5.88% | 110,429 | 100.00% |
| Judge - Court of Appeals of Georgia (McFadden) | 135,379 | 123,352 | 4 | 29 | 0 | 11,555 | 39 | 12,027 | 0.04% | 10.99% | 109,406 | 100.00% |
| Judge - Court of Appeals of Georgia (Pipkin) | 135,379 | 125,575 | 3 | 33 | 0 | 9,387 | 30 | 9,804 | 0.03% | 9.02% | 108,659 | 100.00% |
| Judge - Superior Court - Stone Mountain Judicial Circuit (Asha Jackson) | 135,379 | 134,807 | 2 | 25 | 0 | 159 | 46 | 572 | 0.04% | 0.52% | 109,732 | 100.00% |
| Judge - Superior Court - Stone Mountain Judicial Circuit (Latisha Jackson) | 135,379 | 134,897 | 1 | 29 | 0 | 55 | 45 | 482 | 0.04% | 0.44% | 109,719 | 100.00% |
| Judge - Superior Court - Stone Mountain Judicial Circuit (Johnson) | 135,378 | 134,822 | 6 | 40 | 0 | 81 | 124 | 556 | 0.11% | 0.51% | 108,990 | 100.00% |
| State Court Judge (Alexander) | 135,378 | 134,715 | 7 | 26 | 0 | 354 | 119 | 663 | 0.11% | 0.61% | 109,449 | 100.00% |
| State Court Judge (Anderson) | 135,378 | 134,790 | 1 | 28 | 0 | 292 | 115 | 588 | 0.11% | 0.54% | 109,098 | 100.00% |
| State Court Judge (Panos) | 135,378 | 132,831 | 3 | 26 | 0 | 1,984 | 329 | 2,547 | 0.30% | 2.34% | 108,821 | 100.00% |
| State Court Judge (Wong) | 135,378 | 132,273 | 1 | 17 | 0 | 391 | 2,393 | 3,105 | 2.17% | 2.82% | 110,064 | 100.00% |
| Board of Education D2 | 18,018 | 17,618 | 11 | 2 | 0 | 39 | 286 | 400 | 118.18% | 165.29% | 242 | 1.74% |
| Board of Education D4 | 18,129 | 17,709 | 1 | 2 | 0 | 14 | 359 | 420 | 8.80% | 10.30% | 4,079 | 26.51% |
| Board of Education D6 | 16,321 | 15,966 | 2 | 2 | 0 | 11 | 317 | 355 | 10.63% | 11.90% | 2,983 | 19.77% |
| Mayor - Stonecrest | 9,930 | 9,443 | 1 | 1 | 0 | 252 | 210 | 487 | 4.73% | 10.96% | 4,442 | 46.24% |
| Atlanta TSPLOST | 9,223 | 9,112 | 0 | 0 | 0 | 19 | 92 | 111 | 1.71% | 2.06% | 5,382 | 60.17% |
| Atlanta Public Improvement Bond (Roads, Sidewalks, Paths and Trails) | 9,223 | 9,130 | 0 | 0 | 0 | 5 | 88 | 93 | 1.15% | 1.22% | 7,628 | 85.00% |
| Atlanta Public Improvement Bond (Public Safety, Parks and Rec) | 9,223 | 425 | 0 | 0 | 0 | 7,496 | 1,302 | 8,798 | 18.49% | 124.92% | 7,043 | 79.00% |
| Total: | 5,121,433 | 5,049,672 | 158 | 389 | 0 | 54,973 | 11,057 | 71,761 | 0.34% | 2.19% | 3,273,548 |
For per-ballot evidence images and the full contest-by-contest, group-by-group detail, see the Contest Discrepancy Detail Report.
How contests came to be classified as disagreed, write-ins, overvotes, gray-flagged, or ballot-level variants.
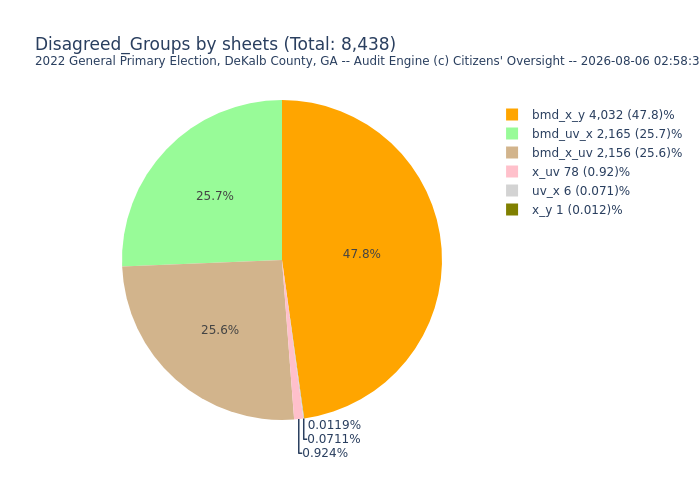
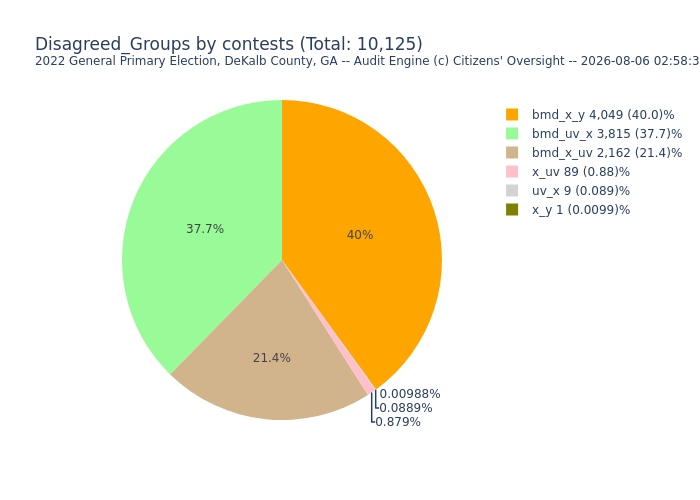
Group x_y_x are the votes correctly interpreted by AuditEngine but incorrectly interpreted by the voting system, but corrected in Adjudication. x_y_y are apparently adjudicated but are actually not reviewed, and so they tend to also be correctly interpreted by AuditEngine. Here we also consider disagreed undervotes, which are too common to consider variants if they are not disagreed.
| Record Type | Sheets | Ballot Contests |
% of Sheets | % of Contests | Description |
|---|---|---|---|---|---|
| x_y | 1 | 1 | 0.012% | 0.0097% | Unadjudicated disagreed contests with votes (gray OK, No BMDs) |
| x_uv | 78 | 89 | 0.91% | 0.86% | Unadjudicated disagreed contests with CVR undervotes (gray OK, No BMDs) |
| x_ov | - | - | 0.0% | 0.0% | Unadjudicated disagreed contests with CVR undervotes, (gray OK, No BMDs) (x_ov). |
| uv_x | 6 | 9 | 0.070% | 0.087% | Unadjudicated disagreed undervotes with CVR votes (uv_x) No BMDs |
| bmd_x_y | 4,032 | 4,049 | 47.0% | 39.2% | Unadjudicated disagreed contests with votes (gray OK, Only BMDs) |
| bmd_x_uv | 2,156 | 2,162 | 25.1% | 20.9% | Unadjudicated disagreed contests with CVR undervotes (gray OK, Only BMDs). This can occur if the AuditEngine BMD OCR parsing is making an error. |
| bmd_uv_x | 2,165 | 3,815 | 25.2% | 36.9% | Unadjudicated disagreed undervotes with CVR votes (bmd_uv_x). Only BMDs This can occur if the AuditEngine BMD OCR parsing is making an error. |
| unadj_uncategorized | 141 | 211 | 1.6% | 2.0% | Unadjudicated uncategorized. Ex: 01170_00000_296448, 01600_00000_426108, 04201_00000_022121, 01440_00000_517301, 04101_00000_874828, 04065_00000_938543, 00580_00000_717729, 04065_00000_017435, 04066_00000_323457, 00790_00000_482662 |
| uncategorized | - | - | 0.0% | 0.0% | Contest Variants that have not been categorized into any groups. This should be empty. |
| Total | 8,579 | 10,336 |
Completely blank ballots, ballots with no CVR record, corrupted images, and any that we find had a different style in CVR from the ballot.
| Record Type | Sheets | Ballot Contests |
% of Sheets | % of Contests | Description |
|---|---|---|---|---|---|
Ballot Variants |
- | - | 0.0% | 0.0% | Ballot sheets that have deviations at the ballot level, style mismatch, no-cvr, or blank). |
Blank Sheets |
- | - | 0.0% | 0.0% | Ballot sheets where no selections are detected. |
Distorted |
- | - | 0.0% | 0.0% | Ballot images that have been detected as distorted, due to slippage during scanning or damaged original, and cannot be automatically evaluated. |
No CVR |
0 | - - - | 0.0% | 0.0% | Ballot sheets that have images but no CVR record and cannot be compared. |
Images Missing |
0 | - - - | 0.0% | 0.0% | Ballots that exist in the CVR but are not available as ballot images. |
Not Processed |
356 | - - - | 0.0% | 0.0% | Ballots that were NOT successfully processed by AuditEngine. These are generally due to images that are distorted due to 'stretching' of the image when the page is not evenly fed through the scanner, barcodes that were corrupted and unreliable, or BMD ballots that were not perfectly read using OCR. Cleaning or replacing the scanner rollers can help to avoid distorted images. See Unprocessed Ballots Report for details. Ex: 05012_00002_000001, 05012_00002_000002, 05012_00002_000003, 05012_00002_000004, 05012_00002_000005, 05012_00002_000007, 05012_00002_000008, 05012_00002_000009, 05012_00002_000010, 05012_00002_000011 |
bv_uncategorized |
- | - | 0.0% | 0.0% | Uncategorized Ballot Variants . This should be empty. |
| Record Type | Sheets | Ballot Contests |
% of Sheets | % of Contests | Description |
|---|---|---|---|---|---|
Contest Variants |
46,438 | 71,761 | 83.9% | 86.6% | Ballot-Contests logically removed from Variants Removed Sheets that have variations at the contest level. These will be further broken down based on the reason for the variation. Contest Variants includes those contests with write-ins, overvotes, gray-flags, and disagreements when the evaluation is compared between that of AuditEngine and the voting system, and are not included in Non-Variant and Variants Removed Sheets, because they are logically removed. |
Disagreed (combined groups) |
8,891 | 11,066 | 16.1% | 13.4% | All contests that do not agree between the CVR and Audit result, and may include write-ins, overvotes and be flagged as gray. This category is only available if the CVR is available for comparison at the ballot level. |
Ballot Variants |
- | - | 0.0% | 0.0% | Ballot sheets that have deviations at the ballot level, style mismatch, no-cvr, or blank). |
| uncategorized | - | - | 0.0% | 0.0% | Contest Variants that have not been categorized into any groups. This should be empty. |
Blank Sheets |
- | - | 0.0% | 0.0% | Ballot sheets where no selections are detected. |
Write-ins are normally the vast majority of variants.
If adjudication records are not provided by the voting system, then write-ins may still have been reviewed by election staff prior to producing the CVR, and there is no indication of that processing in the data. However, if it appears that all writeins that are blank are marked as an undervote, and all writeins that are fully legitimate are marked as a vote for the appropriate listed candidate or qualified writein candidate, then it is likely that all write-ins have been reviewed by the election staff.
If adjudication is performed by the voting system and modified records provided, the fact that an adjudication record does not exist does not necessarily mean they were not reviewed and then confirmed. Conversely, just because an adjudication record does exist does not mean that contest was inspected, unless the 'modified' record differs from the 'original' record. There is no adjudication marking in the modified record that allows an adjudicator to inspect the record and mark it as confirmed.
| Record Type | Sheets | Ballot Contests |
% of Sheets | % of Contests | Description |
|---|---|---|---|---|---|
| wi_wi | - | - | 0.0% | 0.0% | Agreed Writeins (No BMDs, gray OK). |
| bmd_wi_wi | - | - | 0.0% | 0.0% | Agreed Writeins (BMD Only, gray OK). BMD writeins are keyed in, making these easier for staff to capture and review. |
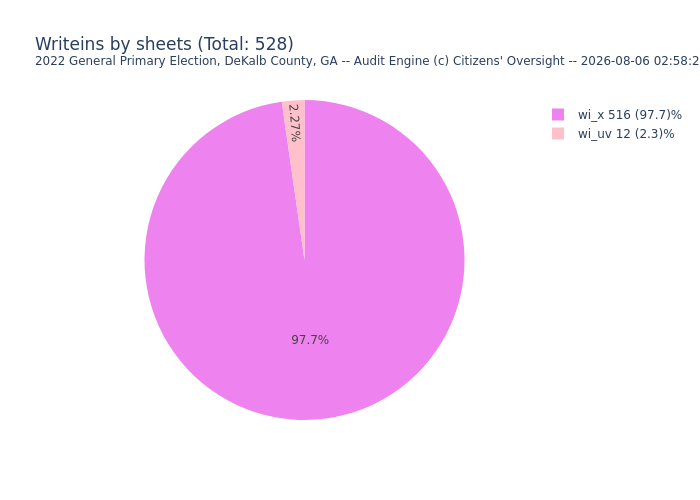
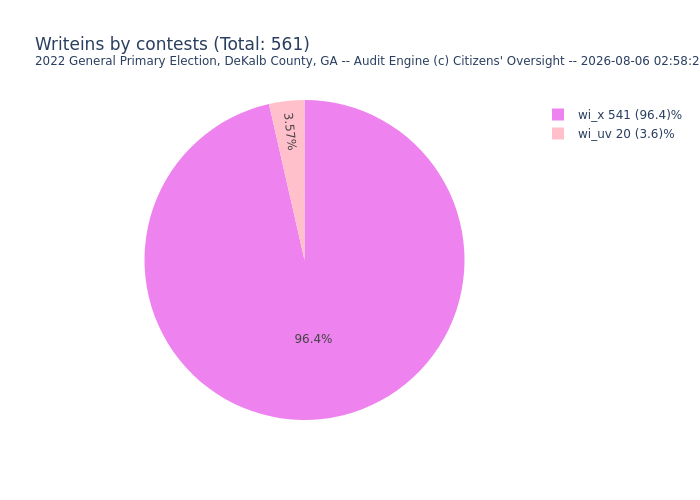
| wi_uv | 12 | 20 | 0.41% | 0.31% | Writeins detected by AuditEngine and CVR lists as an undervote (wi_uv) (gray OK, bmds OK). In these cases, the write-in may have been adjudicated and recorded as an undervote if the name written in is blank or is not a qualified write-in candidate. |
| wi_ov | - | - | 0.0% | 0.0% | Writeins detected by AuditEngine and CVR lists as an overvote (wi_ov) (gray OK) (NO BMDs). |
| wi_x | 516 | 541 | 17.5% | 8.4% | Writeins detected by AuditEngine and CVR lists as a vote (wi_x) (gray OK) (BMDs OK). In these cases, the write-in may have been adjudicated and recorded as a vote for a qualified write-in candidate. |
| subtotal_main_writeins | 528 | 561 | 17.9% | 8.7% | Subtotal of the most frequently encountered write-in groups |
| subtotal_other_writeins | 0 | 0 | 0.0% | 0.0% | Subtotal of 'other' write-in groups |
| wi_rest_unadj | 2,414 | 5,880 | 82.1% | 91.3% | Writeins uncategorized (gray OK) (BMDs OK). |
| Total | 2,942 | 6,441 |
| ballot_id | bmd? | contest | a==co | a_wi | a_uv | a_ov | a_v | a_gy | co_wi | co_uv | co_ov | co_v | |||||||
|---|---|---|---|---|---|---|---|---|---|---|---|---|---|---|---|---|---|---|---|
| 04251_00000_298118 | 1 | State Court Judge (Alexander) | 0 | 1 | 0 | 0 | 1 | 0 | 1 | 1 | 0 | 0 | 0 | 0 | 0 | 0 | 0 | 0 | 0 |
| 01330_00000_129141 | 1 | Board of Education D6 | 0 | 1 | 0 | 0 | 1 | 0 | 1 | 1 | 0 | 0 | 0 | 0 | 0 | 0 | 0 | 0 | 0 |
| 01330_00000_157185 | 1 | Justice - Supreme Court of Georgia (LaGrua) | 0 | 1 | 0 | 0 | 1 | 0 | 1 | 1 | 0 | 0 | 0 | 0 | 0 | 0 | 0 | 0 | 0 |
| 01330_00000_157185 | 1 | Judge - Court of Appeals of Georgia (Barnes) | 0 | 1 | 0 | 0 | 1 | 0 | 1 | 1 | 0 | 0 | 0 | 0 | 0 | 0 | 0 | 0 | 0 |
| 01330_00000_270446 | 1 | Judge - Court of Appeals of Georgia (McFadden) | 0 | 1 | 0 | 0 | 1 | 0 | 1 | 1 | 0 | 0 | 0 | 0 | 0 | 0 | 0 | 0 | 0 |
| 01330_00000_311669 | 1 | Justice - Supreme Court of Georgia (Colvin) | 0 | 1 | 0 | 0 | 1 | 0 | 1 | 1 | 0 | 0 | 0 | 0 | 0 | 0 | 0 | 0 | 0 |
| 01170_00000_278291 | 1 | Justice - Supreme Court of Georgia (Colvin) | 0 | 1 | 0 | 0 | 1 | 0 | 1 | 1 | 0 | 0 | 0 | 0 | 0 | 0 | 0 | 0 | 0 |
| 01170_00000_278291 | 1 | Justice - Supreme Court of Georgia (LaGrua) | 0 | 1 | 0 | 0 | 1 | 0 | 1 | 1 | 0 | 0 | 0 | 0 | 0 | 0 | 0 | 0 | 0 |
| 01170_00000_278291 | 1 | Justice - Supreme Court of Georgia (McMillian) | 0 | 1 | 0 | 0 | 1 | 0 | 1 | 1 | 0 | 0 | 0 | 0 | 0 | 0 | 0 | 0 | 0 |
| 01170_00000_278291 | 1 | Judge - Court of Appeals of Georgia (Barnes) | 0 | 1 | 0 | 0 | 1 | 0 | 1 | 1 | 0 | 0 | 0 | 0 | 0 | 0 | 0 | 0 | 0 |
Overvotes will only occur on hand-marked ballots and may have already been reviewed by election staff.
When adjudication records are provided, election workers sometimes mark overvotes as undervotes during adjudication, to keep track of whether an overvote has been reviewed. Any overvotes that are converted to votes will no longer have an overvote marking, and those that are indeed overvotes are converted to undervote marking. Although this may be a workable approach, it unfortunately distorts the statistics regarding overvotes, because normal reporting will say that no overvotes exist.
When this practice is used, and if adjudication is used, 'ov_ov_uv' is an actively confirmed overvote, while 'ov_ov_ov' means only that the adjudication record was created, but we don't know if this contest was reviewed and confirmed.
| Record Type | Sheets | Ballot Contests |
% of Sheets | % of Contests | Description |
|---|---|---|---|---|---|
| ov_ov | - | - | 0.0% | 0.0% | Agreed overvotes (ov_ov) (gray OK). |
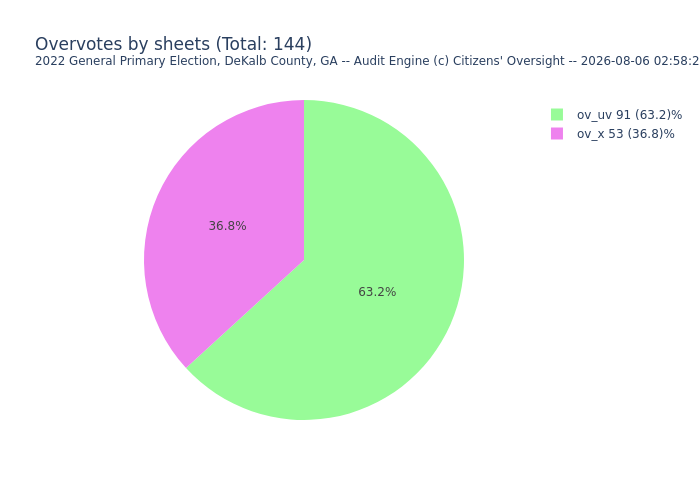
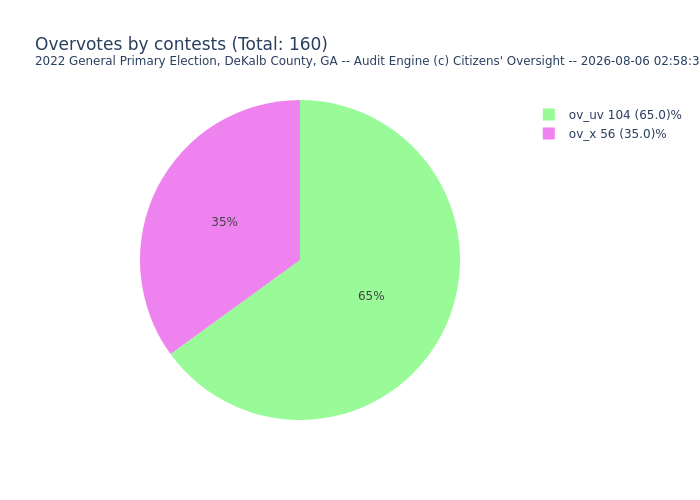
| ov_uv | 91 | 104 | 62.8% | 64.6% | Overvotes described as undervotes in CVR (ov_uv) (gray OK). May not be considered disagreed. |
| ov_x | 53 | 56 | 36.6% | 34.8% | Unadjudicated Disagreed overvotes, CVR votes (ov_x) (gray OK). |
| ov_rest_unadj | 1 | 1 | 0.69% | 0.62% | Unadjudicated overvotes uncategorized (gray OK) (No BMDs). |
| Total | 145 | 161 |
| ballot_id | bmd? | contest | a==co | a_wi | a_uv | a_ov | a_v | a_gy | co_wi | co_uv | co_ov | co_v | |||||||
|---|---|---|---|---|---|---|---|---|---|---|---|---|---|---|---|---|---|---|---|
| 04000_00023_000028 | 0 | Judge - Court of Appeals of Georgia (McFadden) | 0 | 0 | 0 | 1 | 0 | 0 | 1 | 1 | 0 | 0 | 0 | 0 | 0 | 0 | 0 | 0 | 0 |
These contests are marked as variants only because AuditEngine noted ambiguous votes or heuristic vote resolution.
| Record Type | Sheets | Ballot Contests |
% of Sheets | % of Contests | Description |
|---|---|---|---|---|---|
| x_x_gry | 39,166 | 53,060 | 97.6% | 96.8% | Unadjudicated agreed contests with votes, marked gray_eval |
| uv_uv_gry | 945 | 1,763 | 2.4% | 3.2% | Unadjudicated Agreed undervotes, flagged as gray (uv_uv_gry). |
| Total | 40,111 | 54,823 |